
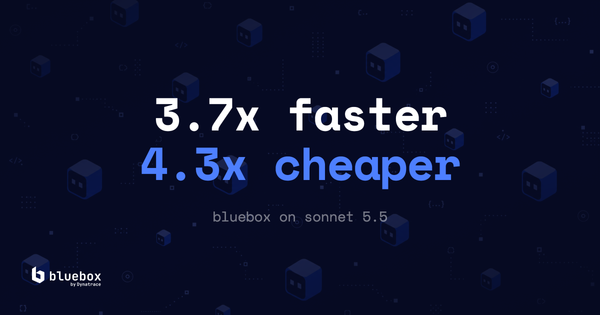
Switching Bluebox to Sonnet 5.5: the eval results
Bluebox runs on Anthropic's Sonnet 5.5 model since October 1. In our evals with SREGym, Sonnet 5.5 diagnosed more problems correctly than Sonnet 5




Every team shipping with a coding agent eventually faces the same moment. The agent pushes something to production. Something breaks. And someone says: we need better monitoring.
The next step is usually the same too. You wire up a few dashboards, add some alerts to your existing metrics stack, maybe pipe logs into an ELK cluster you already have running. Done in a day. Problem solved.
That confidence is the trap.
The typical homegrown monitoring stack for a development team building with coding agents has three layers, and they rarely talk to each other.
Metrics live in Prometheus or a cloud provider's native tooling. Logs go to Elasticsearch, Loki, or CloudWatch. Traces, if you have them at all, end up in Jaeger, Zipkin, or Tempo, configured by one engineer who has since moved on. Each system has its own query language, its own retention policies, and its own alert format.
When something breaks in production, an engineer has to open three tabs, correlate timestamps manually, form a hypothesis, and then describe that hypothesis in a prompt to the coding agent. The agent writes code based on a description of a problem, not the problem itself.
This works. Until it doesn't.

Getting metrics, logs, and traces to tell a coherent story about a single incident is not a tooling problem. It is a data architecture problem, and it is one of the hardest problems in production engineering.
The issue is context;
Correlating those three signals across services, at the right timestamp, in the right sequence, requires a data model that understands causality rather than just storing events.
Most DIY stacks store data in silos and leave the correlation to the engineer. That works when you have one service and one engineer who knows every line of code. It breaks down fast when a coding agent is shipping changes across five services, and the incident could be anywhere in the call graph.
And that is before you even get to the topology question. Which services depend on which? What changed in the last deployment window? What is the blast radius if this particular database goes down? A patchwork of Prometheus exporters and Grafana dashboards does not answer those questions. It surfaces numbers. The reasoning is still on you.

Building a system that actually preserves context across all three signal types, maps causal dependencies automatically, and stays accurate as your architecture evolves is a multi-year engineering investment. It is not something you assemble in a sprint.
Most monitoring tools tell you that something is wrong. That is not the same as telling you why it went wrong.
The distinction matters enormously when your coding agent is the one that needs to act. An alert saying "error rate elevated in checkout-service" is useful to a human engineer who can open a terminal and start digging. It is not useful to a coding agent that needs a specific code path, a specific commit, and a concrete description of the failure mode to write a fix with any confidence.
Real root cause analysis understands causation, not just correlation. It knows that a connection pool exhaustion in one service is the cause of a cascading timeout three hops downstream, not just a coincidence that happened to appear at the same time. Getting that right across a dynamic, micro-services architecture, without generating false positives on every noisy metric, requires years of refinement.
Most teams that try to build this themselves end up with a smarter threshold alert and call it root cause analysis. Their engineers still spend hours each week doing the actual investigation, and then writing up the findings in a format their coding agent can use.

Some teams try a shortcut: feed the raw logs and metrics directly to their coding agent and let it do the correlation. This works occasionally. But it is non-deterministic - the same incident can produce a different diagnosis depending on which logs you pull, in what order, and how you frame the prompt. More importantly, it is expensive. Sending thousands of log lines and metric snapshots across three systems through an LLM context window burns tokens fast. At any meaningful incident volume, that cost compounds quickly, and you still have no guarantee the agent landed on the right root cause rather than a plausible-sounding one.
That is exactly the bottleneck Bluebox is designed to eliminate.
Here is the real question behind the monitoring decision: what is the highest-value use of your engineering team's time?
If your team is spending hours each week investigating production incidents, correlating signals across siloed systems, writing up findings for coding agents, and then verifying that fixes actually held, that is time that is not going toward shipping new product. With coding agents in the loop, the expectation for shipping velocity has fundamentally changed. The constraint is no longer how fast you can write code. It is how fast you can safely get code into production and trust that it works.
A homegrown monitoring setup does not reduce that constraint. It relocates the bottleneck. Instead of waiting on engineering cycles to write features, you wait on engineering cycles to investigate incidents and translate findings into agent-readable prompts. The loop from incident to fix still requires a human in the middle, doing work the machine should be doing.
Your team should be shipping. The monitoring, investigation, and fix-plan generation should be automated.

Bluebox is designed from the ground up for coding agents rather than human dashboards. It is powered by Dynatrace Intelligence, which has had over two decades of production observability engineering and training behind it.
Before your agent writes a line of code, Bluebox generates a production brief: a structured summary of your live service topology, traffic patterns, error rates, and runtime constraints. The agent builds for the environment it is actually deploying into, not an imagined one.
After your agent ships, Bluebox monitors production continuously. When an incident surfaces, it investigates root cause automatically. Not an alert. A finding: the specific service, the specific code path, the blast radius, the supporting telemetry. That finding goes directly into a GitHub issue, structured as input for your coding agent, ready to act on without a human writing the brief.
The loop from detection to fix closes without anyone spending their afternoon in three monitoring dashboards. The resolution list that Bluebox addressed is now reviewed over morning coffee after a good night’s sleep.
You do not have to build the data architecture, the topology mapping, the causal AI, or the agent integration. We already did that by building Bluebox. The question is whether you want to spend months building it yourself, or start shipping with it today.
Get started with Bluebox for free
Questions or thoughts? Reach us at hello@bluebox.ai or find us on LinkedIn.
Bluebox runs on Anthropic's Sonnet 5.5 model since October 1. In our evals with SREGym, Sonnet 5.5 diagnosed more problems correctly than Sonnet 5
You've got a coding agent. It writes code fast. But it has no idea what's happening in production: no error rates, no traces, no

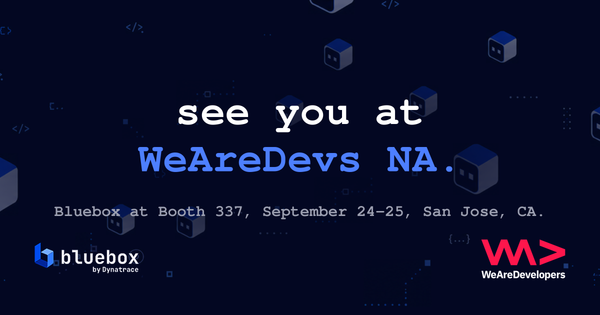
Come meet the Bluebox team, along with 10,000+ other developers, at WeAreDevelopers North America in San Jose this week. September 24th to 25th at the McEnery Convention