
Bluebox at All Things Open 2026
Come meet the Bluebox team at All Things Open in Raleigh, NC, Monday and Tuesday, October 19th and 20th at the Raleigh Convention Center. It is the largest


Coding agents are genuinely good at understanding a local codebase. Point one at a repository and it can read the architecture, trace the data flow, interpret configuration, and reason about what the code is supposed to do.
But code doesn’t run in a repository. It runs in production, where traffic is real, services call each other under load, and the gap between "what the code says" and "what the system does" is exactly where incidents get introduced. An agent working only from the repository is designing against assumptions.
Bluebox closes that gap. You, or your coding agent, can ask about live production behavior and get an answer grounded in real telemetry.
Imagine a situation where support wants to know when each account was last active, so they can tell a quiet customer from one that is about to churn. It is a small ask. The account record already exists and every account action already hits the activity endpoint, so all it takes is stamping a timestamp on the way through.
You add a last_activity_at timestamp to the account record, written on the account activity endpoint. One UPDATE statement, keyed on the primary key, against an indexed column. It passes review because there is nothing to object to, and it runs in well under a millisecond against your local database.
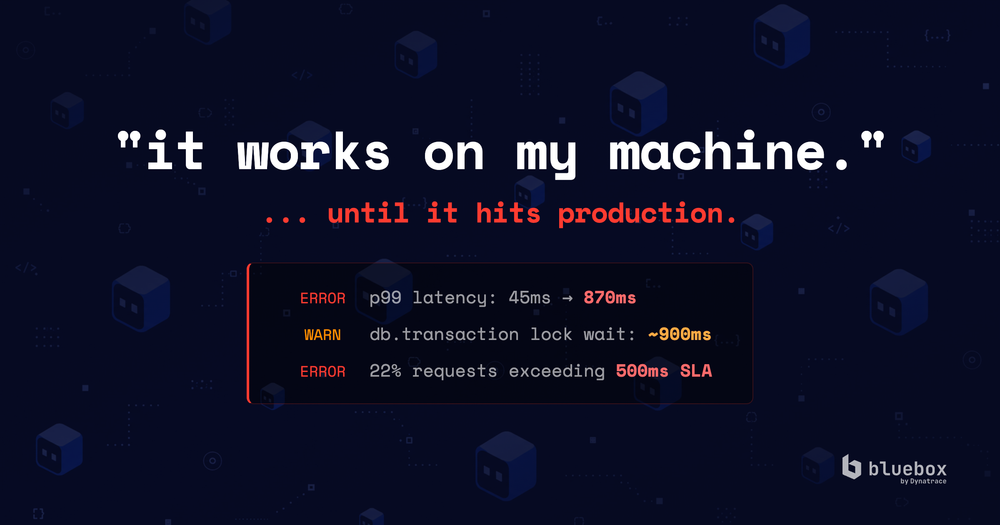
After deploy, p99 latency on that endpoint goes from 45ms to 870ms.
The obvious suspect is the new write. Your agent asks Bluebox where the time is actually being spent:
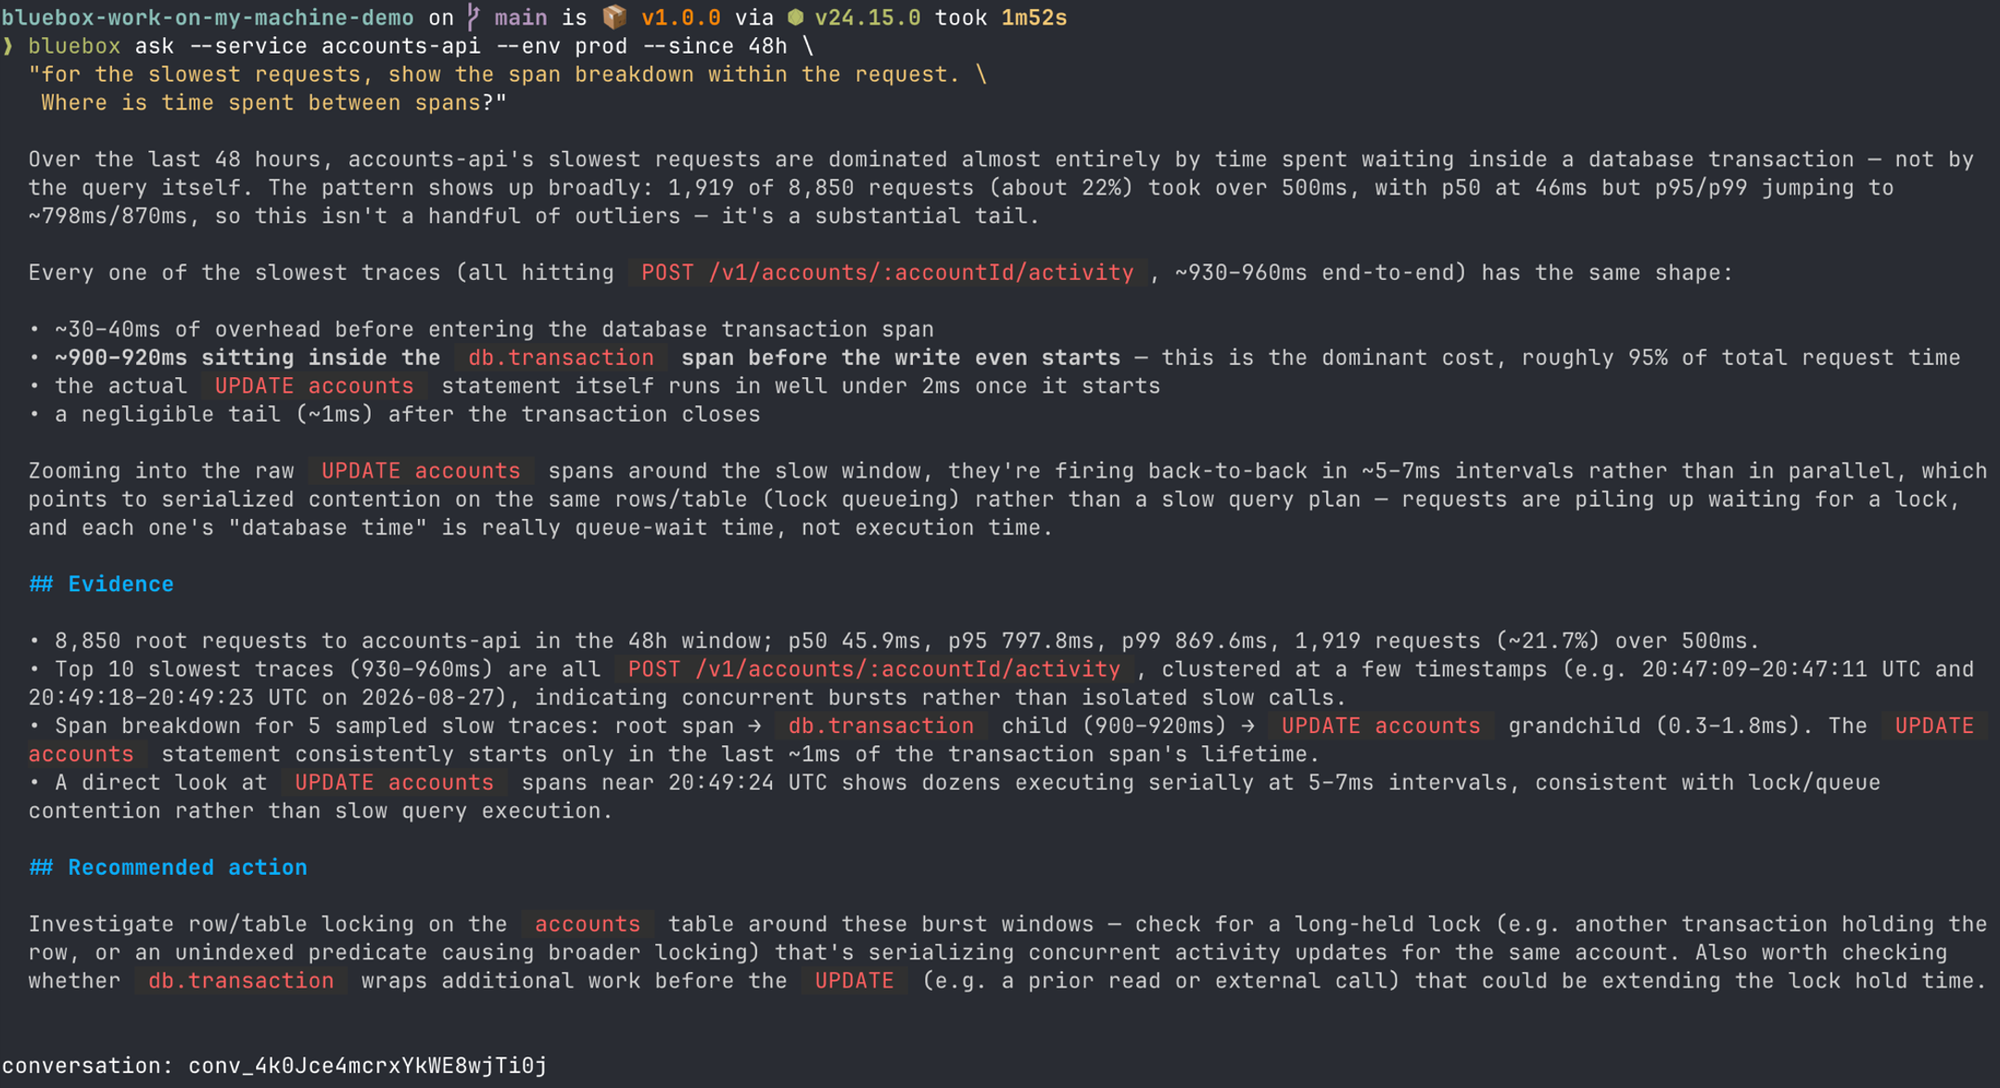
bluebox ask --service accounts-api --env prod --since 48h "for the slowest requests, show the span breakdown within the request. Where is time spent between spans?"
The answer clears the query and locates the wait in one pass. Across 8,850 requests, p50 sits at 46ms while p99 reaches 870ms, and 22% exceed 500ms, so this is a substantial tail rather than a handful of outliers. Every slow trace has the same shape: about 30ms of overhead, then roughly 900ms inside the db.transaction span before the write even starts, then an UPDATE accounts statement that completes in under 2ms.
The raw statement spans fire back-to-back at 5-7ms intervals instead of in parallel:
requests are piling up waiting for a lock, and each one’s "database time" is really queue-wait time, not execution time
The query was never slow, but the queue was.
Okay, that establishes the mechanism, but which customers exactly were impacted? We can ask a follow-up question in Bluebox to continue the conversation without restating any context:
bluebox ask --conversation-id conv_4k0Jce4mcrxYkWE8wjTi0j "which accounts are those slow requests hitting, and is the impact even across tiers?"
The impact is not evenly distributed. Slow requests are entirely confined to large-tier accounts: 1,919 of 8,172 large-tier requests exceed 500ms, against zero of 672 small-tier requests. Three accounts carry all of it, each at a near-identical rate near 23%.
That distribution is why the change survived review and canary. Most accounts were never affected.
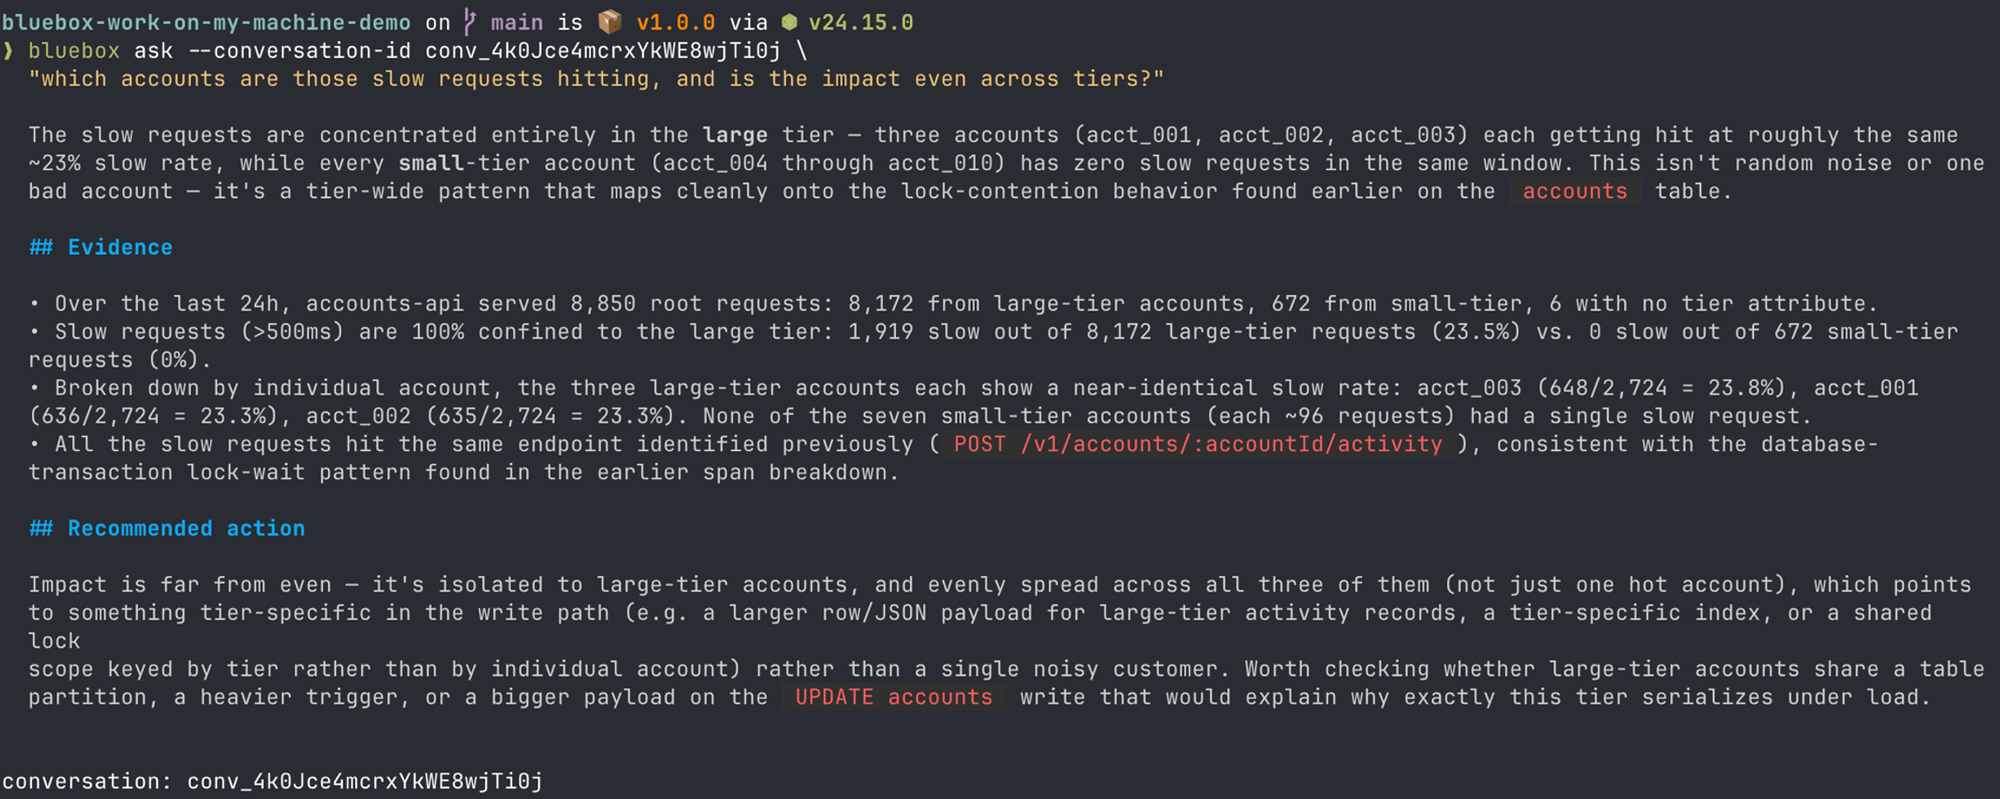
Here, the agent proposes a tier-specific cause: a heavier payload, a tier-specific index, and a lock scope keyed by tier. One more question tests that:
bluebox ask --conversation-id conv_4k0Jce4mcrxYkWE8wjTi0j "how does request volume per account differ between the tiers?"
Each large-tier account sent 2,724 requests in the window. Each small-tier account sent 96. That is a 28:1 ratio per account, with the large tier accounting for 92% of all traffic despite having fewer accounts.
The agent revises its own hypothesis:
large-tier accounts aren’t just tier-flagged, they’re also generating dramatically more concurrent writes to the same accounts table, which would explain why lock queueing shows up there and nowhere in the small tier
It then proposes the experiment that would settle it: drive a small-tier account at large-tier request rates and see whether the slowdown follows.
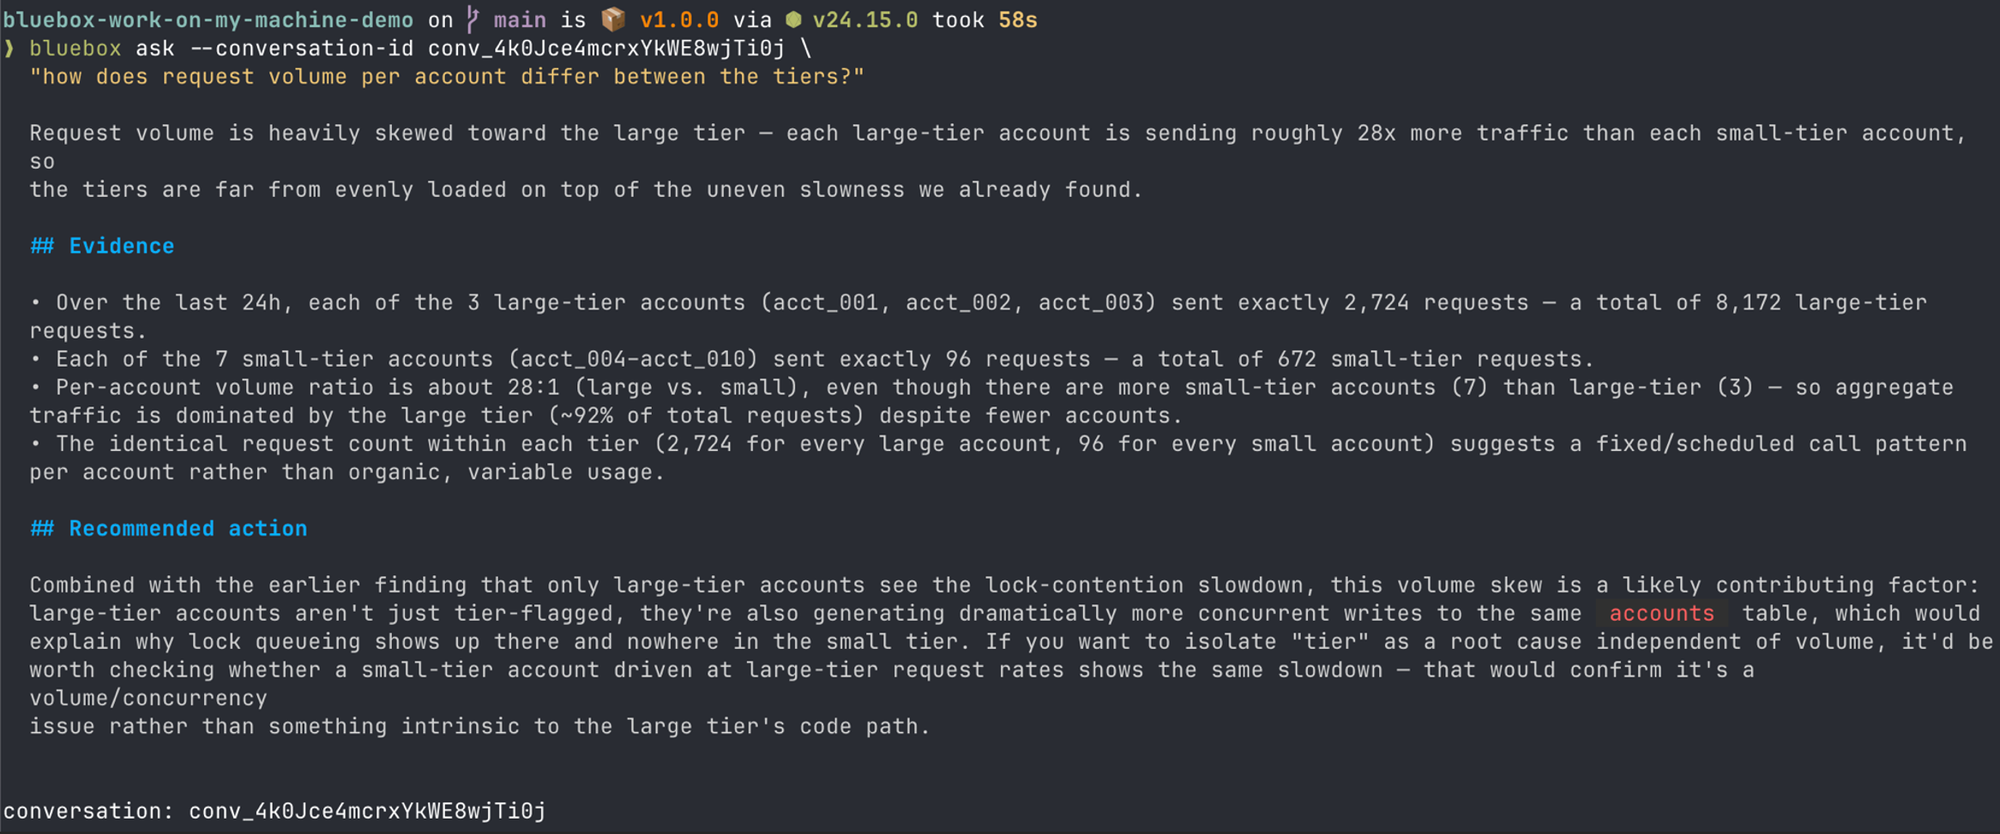
Throughout the investigation, we were able to answer three important questions about how the application actually behaved. The first found the mechanism, the second found the blast radius, and the third corrected the explanation. With that knowledge, the root cause can be quickly identified and addressed properly.
Lock contention requires, well, concurrency. On a laptop, you have one request at a time and one test account, so the transaction acquires its lock instantly, and the change is genuinely correct in that environment. Under 150 concurrent requests against a single account row, every assumption the code makes still holds, and the endpoint is still 20x slower.
The code is correct, but the conditions it runs under are different. It’s the classic "it works on my machine" scenario.
From here, the fix is a design decision. Debounce the write so it fires at most once per account per minute. Move it out of the request path. Append to a separate table instead of updating a hot row. Each carries different tradeoffs, and the agent can weigh them because it now knows the real write rate and the shape of the contention.
Bluebox works by understanding the OpenTelemetry data your service emits and reasoning over it in natural language. That makes the quality of an answer highly dependent on two things: the richness of the telemetry and the context provided in the question.
It’s worth noting that all the questions in the investigation were run from within the repository, and the directory itself is an input. Before any network call, the CLI reads your git origin remote, canonicalizes it, and sends it along with the question.
That URL helps Bluebox bridge code to running telemetry. We use OpenTelemetry resource attributes to establish which running service a question is about:
The repository URL comes for free. --service and --env narrow things further when one repository holds several services or runs in several environments, which is why the questions above carry them. Getting that context right is most of what separates a vague answer from a precise one.
This is where a coding agent comes in handy. It already knows which service you’re editing, which environment you’re targeting, and which commit you just shipped, so it can supply that context without being asked. You describe the symptom and the agent fills in the coordinates.
The same principle governs what you can ask about. The span breakdown in the first question came from the standard HTTP and database conventions, which most instrumentation emits by default. The blast radius in the second came from account.id and account.tier, two custom attributes, because no convention covers tenancy. Bluebox answers questions about the dimensions your telemetry carries, so if you expect to ask about customer tier, region, or feature flag state, put them on the span before you need them.
The OpenTelemetry semantic conventions are a perfect fit for this problem, so Bluebox builds on them directly.
"It works on my machine" describes a knowledge gap. The repository tells you what the code does. Production tells you what the system does under real concurrency, real data volume, and real customer distribution. Agentic coding tools have only ever had the first half.
The combination is what makes this work. Bluebox supplies the production half and your coding agent supplies the code half. When Bluebox proposed a tier-specific index or a heavier write payload, those were hypotheses about code, and an agent reading the repository can confirm or kill them in seconds. Neither half reaches the answer alone.
That loop runs in both directions. Investigating a regression, you start at the symptom and work back to the line that caused it. Planning a feature, you start at the code and ask what production will do to it before you write anything. Same telemetry, same agent, different starting point.
Come meet the Bluebox team at All Things Open in Raleigh, NC, Monday and Tuesday, October 19th and 20th at the Raleigh Convention Center. It is the largest
In this post: the questions Bluebox answers about a release, and the prompts to ask them. Then how we run them automatically in our own GitHub Actions pipeline,

The Bluebox MCP server is now available to everyone. Connect Claude Code, Cursor, Visual Studio Code, Kiro, Codex, or any other MCP client, and your coding agent can