
Investigation with context and confidence
Why would you need Bluebox to run an investigation? In theory, your application is always working perfectly in the production environment. While in practice, it is not. One



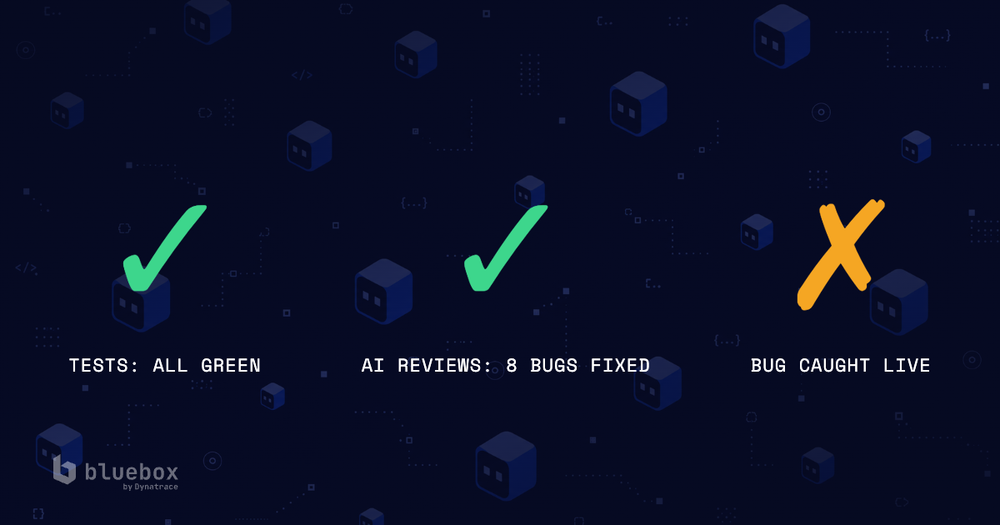
31 unit tests. A Bluebox architecture review before a single line of implementation existed. A Claude code review after 1,252 lines were written. All green. But then Bluebox queried the live telemetry and found that roughly half of all traced event types were silently missing their event.source attribute - a bug in the tracing I just built. Not a single test caught it. One live query did.

Editor's note: Florian is drinking Mai Tais in Ko Phi Phi at the time of publishing and did not approve being pictured as Rachel for the sake of this post.
That's not a story about bad AI tooling. It's a story about what static analysis, whether of a plan or of code , fundamentally cannot see, and what live telemetry can.
I'm leading Developer Experience at Dynatrace and a former engineer. I've been running openHAB at home as a real production system for years (lights, heating, sensors, automations, the whole stack). openHAB is an open-source home automation platform built on Apache Karaf, an OSGi plugin container. Bundles start, stop, and reconfigure live, long after the JVM has booted. A thermostat rule that worked at startup can break silently after a settings reload if the telemetry SDK underneath it isn't wired correctly for that lifecycle.
I wanted to understand what was happening inside my home automation system: latency, errors, the events that fail silently in the middle of the night. The project had a community pull request adding basic logging via OpenTelemetry, but no metrics, no traces. In order to get deeper visibility when issues occur, I decided to extend it.
openHAB has no staging environment. The maintainers are volunteers. The only person checking whether my code works before a volunteer presses merge is me. That constraint shaped every decision I made about how to build and verify this.
I was extending an unmerged OpenTelemetry pull request for openHAB, adding a full metrics and traces pipeline on top of an existing logs-only PR. Bluebox reviewed the architecture before any line was written, and verified every phase against a live backend before anyone else saw the diff. Claude was the implementation engine in between.
Before any code was written, I used Bluebox to prepare 2 openHAB community forum posts, grounding the proposal in the project's actual constraints rather than guessing at them. 3 options exist for wiring OpenTelemetry into openHAB:
| Approach | What it does | Why ruled out or chosen |
|---|---|---|
| Bundled collector + Grafana stack | Ships a pre-configured OTel collector and visualization stack with the add-on | Rejected by maintainers: add-ons can't depend on external infrastructure |
| Java agent (-javaagent) | Attaches at JVM startup; auto-instruments HTTP and JVM metrics | Requires a launch flag and restart; can't instrument already-loaded OSGi classes |
| OTel SDK inside the bundle ✓ Chosen | Embeds the SDK directly; owns lifecycle, pipelines, and identity | Self-contained, handles OSGi live-reconfigure, runs anywhere openHAB runs |
A maintainer, Markus Storm, answered with a hard constraint in writing: "if you want to build something into openHAB... it must not rely on a specific OS, database or other non-openHAB-core/addon component." An earlier version of the idea (a bundled collector and Grafana stack by default) had already been rejected for exactly that reason. So I went with the SDK in-bundle path as the only path that worked given the constraints.
It owns its own lifecycle, has to coexist cleanly with any Java agent already loaded in the host JVM, and has to produce a consistent service identity across 3 independently built pipelines, each using a different library, and each generating its own OTLP identity by default. That's exactly the kind of design complexity that's cheap to catch in a plan and expensive to untangle in a multi-file implementation.
Claude built the architecture plan against the maintainer constraints. Bluebox reviewed it before any implementation was written and caught 4 bugs. All four were design-level errors, the kind that only get harder to reason about once they're spread across a multi-file implementation.
Reviewing the plan before writing any code came from a simple principle: design mistakes are cheaper to fix than implementation mistakes. In a structured plan, each of those 4 issues was a few sentences. In finished code spread across 14 files, they would have been much harder to surface.
Claude wrote the implementation: 14 files changed, 1,252 lines added, 31 unit tests. Then I ran a post-build code review, this time with Claude, reviewing the finished implementation against a hardening checklist.
It caught 4 more bugs none of the planning review had surfaced:
1. A non-positive metrics interval that crashed activation
2. A NaN sampling ratio that silently dropped every trace
3. A span left open on exception
4. A secret-length leak in a debug log
2 full static review passes. 8 bugs caught before any code touched a real system. 1 widely cited estimate puts the ceiling for AI-assisted review at roughly half of real bugs (Source: Oreilly Radar) which explains why the second pass still found things the first one missed. It also explains what came next.
The obvious assumption: more code review would have caught what shipped next. That framing is...

Estimates consistently put a bug found in production at 10 to 30 times the cost of one caught during implementation (See BetterQA “cost of fixing bugs by the SDLC stage”). openHAB has no staging environment. This add-on has no dedicated QA team. The volunteer maintainer merging the PR is the last checkpoint before it reaches real users' home automation systems. The only way to know the thing genuinely worked was to run it against a live backend before anyone else ever saw the diff.
After each implementation phase: logs, then metrics, then traces, then hardening, I pointed the pipeline at Bluebox and asked, in plain language, whether the signals were actually arriving. Not once at the end. After every phase gate, before moving to the next one.
Static analysis: whether of an architecture plan or of finished code, only answers one question: does this look correct on the page? It can't tell you whether the code behaves correctly once it's running. That's a different question, and it needs a different kind of check.
Bluebox first metrics query came back “not arriving”. That was the wrong query. Bluebox had targeted a derived, backend-side service, `instead of the actual metric names my bundle was emitting. It recognized the mismatch, explained what it had queried and why that result couldn't be trusted, and reframed the query to target the bundle-emitted metric names directly. The second query found 14-plus metric families ingesting continuously.
Why does this matter? A verification tool that accepts "not arriving" as its final answer and closes the session has just handed you a false negative. You'd walk away thinking your metrics pipeline was broken, or worse, not deployed at all. Bluebox instead recognized that absence of data in a derived metric doesn't prove the underlying data isn't there: it just means it looked in the wrong place. It said so. It corrected itself.
Before live verification, the 4 shared identity attributes tying the three pipelines to a single service were design assumptions. Bluebox's comprehensive pass confirmed all four byte-identical across a sampled log entry, span, and metric point.
Across a sampled 15-minute window: roughly 750 log entries, 4,275 spans across 10 distinct openHAB event types. All of it carrying an identical service.name, service.namespace, service.version, and service.instance.id. Three independently built pipelines, one verified identity, confirmed with real data, not a code review guessing the outcome.
Then Bluebox surfaced the one bug neither review pass had caught.
Roughly half of traced event types were missing their event.source attribute. Certain openHAB events return a null source, and my original code passed that straight into the span, unconditionally. That failure mode only exists when real events with real null sources flow through a running system. Two static reviews. Thirty-one tests. None of them are that.
One guard clause and two new tests closed it. That's not a case against code review. It's a case for what only live verification can find, and what no amount of static analysis ever will.
Two honest misses.
1) I'd planned to keep a running implementation log specifically to source this account. That discipline slipped mid-build. Most of the concrete detail here came from reconstructing commit messages and a fresh review pass afterward, not a log kept as it happened. Train your own process, not just your models.
2) Building on an unmerged, still-moving upstream branch cost real reconciliation time. Waiting for the merge would have avoided it entirely. I didn't wait.
The real risk in this project was never bad code. Claude's code was well-reasoned and well-tested. The risk was code that looked correct and wasn't, because Claude had no production runtime context to reason against. A coding agent working from static code alone has a structural blind spot where runtime behavior should be. Real telemetry is what closes that loop, before it hits production.
Why would you need Bluebox to run an investigation? In theory, your application is always working perfectly in the production environment. While in practice, it is not. One

If you've ever shipped a feature and held your breath waiting to see what broke in production or spent hours re-prompting your coding agent just

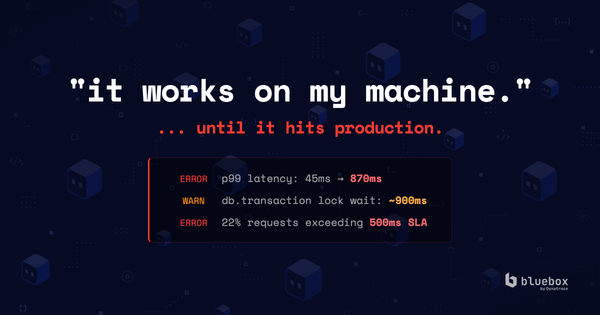
Coding agents are genuinely good at understanding a local codebase. Point one at a repository and it can read the architecture, trace the data flow, interpret configuration, and
